

Want to learn how to set up your google analytics the right way? Recently I have been studying to do my Google Analytics Certification. And I wanted to share with my follower’s step by step instructions on how to set up your Google Analytics Account. And the value that it can add to your business. If you’re using Google Analytics with MonsterInsights I have a post on how to set that up.
Table of Contents
This Post is For A Beginner Level
You can choose to jump to more advanced tools of Google Analytics in my other post. However if your new I would suggest going through the basics to understand the dashboard, reports, and where to find them. You can then move on to the advanced section to learn more about how to use the reports and set them up properly.
Why Google Analytics?
Having a successful business is not always built on guesswork. Although some may disagree businesses tend to thrive when given the ability to make data-driven decisions.
It is important to know how your viewers are interacting with your website. You will want to know what pages or posts are bringing you the most traffic. Therefore giving you the metrics to see what is working and what isn’t working. Google Analytics also is the industry standard for web analytics and it is a requirement to apply for most digital marketing or any advertising positions.
How Does Google Analytics Actually Work?
Google collects the data by adding a tracking code that collects anonymous information about the visitor and how they interact with your website. The tracking code is automatically added to each page on the website. Each URL will have a different code.
This makes it possible for Google to give you the information on your most popular post or product. Even if the viewer has completed a transaction to knowing which browser they used. If they were male or female, the location and so much more.
Google does use a small cookie that they store in your browser to determine new and returning users. Each time a visitor comes to your website. This is called a session and will end a user session after 30 minutes of not being active on the site. Or of course when the user closes their browser. I will show you the full tutorial on how to change the session time if you should want that to extend past the 30 minutes.
Once this is done google will store the information for you to generate reports to help you make those data-based decisions.
How To Set Up Your Google Analytics
Step 1
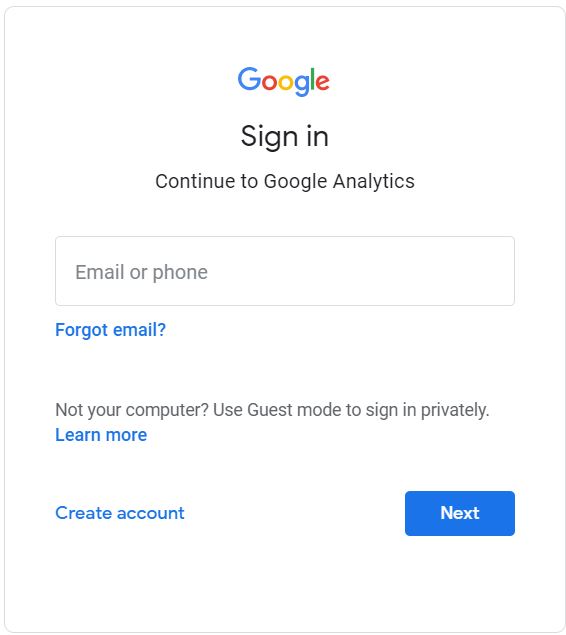
Create and Sign in to your Analytics account. Just enter the address google.com/analytics to set up your account if you do not have one already.
Step 2
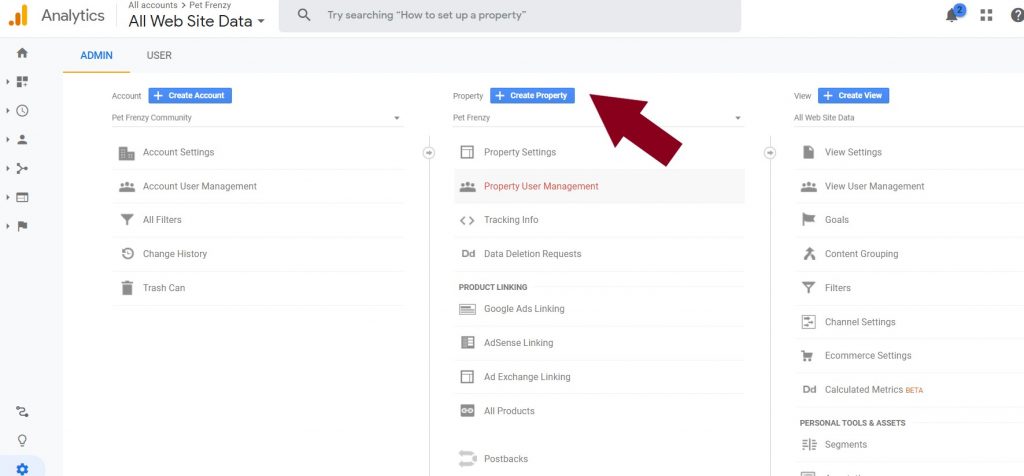
You now want to set up a property. This represents your website or app and is the collection point to all your data that Google will analyze. From the home page, you will notice in the far left corner. You will see the settings icon. Click on that to bring you to this page and create your property. It will just ask you some basic questions about your website or app.
Step 3
Add your tracking code to your website. You can get the tracking code for your site at the Admin /Tracking Info and add this code right after the opening tag on each page you want to track. OR
If you’re using WordPress you can just add the Tracking ID rather than the code into the header section of your website. This will depend on what theme you are using. There are ways to do this without using a plugin. If you want you can use a plugin for WordPress.org called Header and Footer.
Step 4
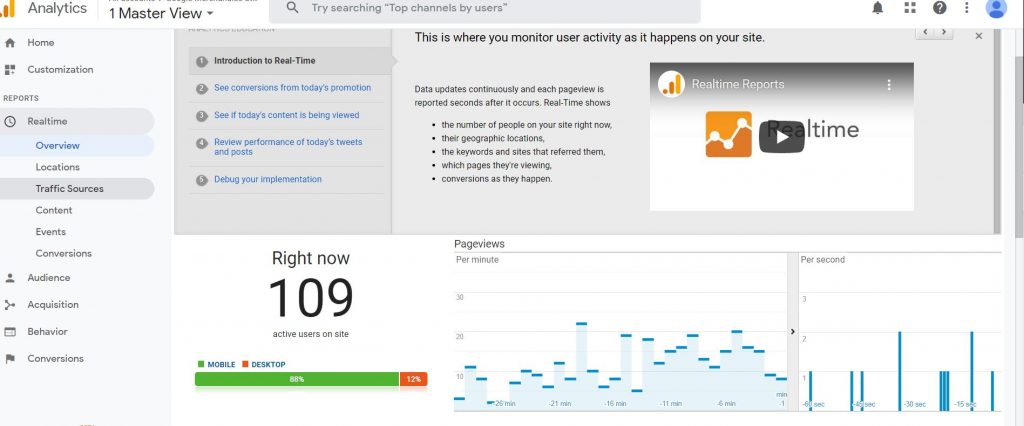
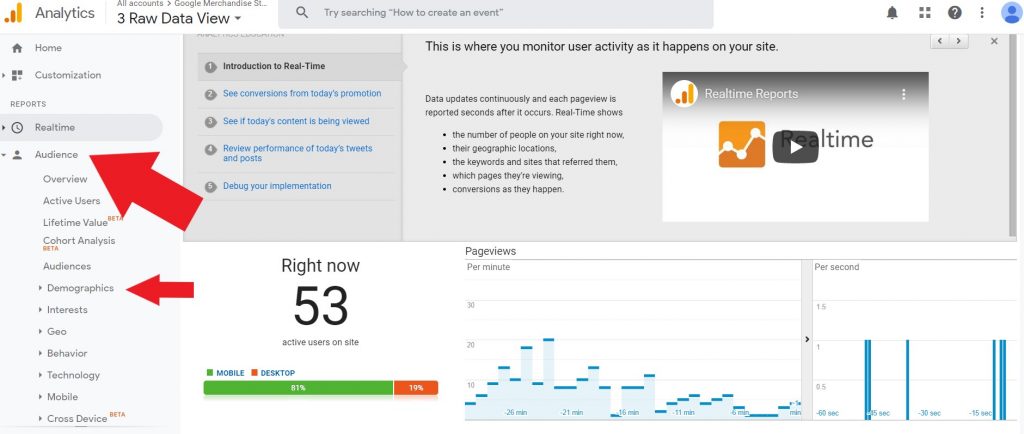
You will want to verify that your tracking code is working. You can check the Real-Time / Overview your screen will look something like this:
Learning the Basics to Google Analytics
Create Reporting Views
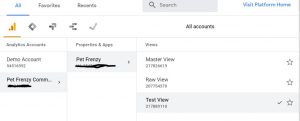
Account/Property/View represents the hierarchy of accounts in Goggle Analytics
Your Account is your access point for analytics. A property is a website or app ( You can add up to 50 Properties to your account) A view is data from the property. You can add up to 25 Views per property.
Now, you’re probably asking why you want to create so many views per property. Once you have added a property to your account, Google Analytics creates a reporting view for you. So I always recommend leaving the original view unchanged. It’s like having a back up of the data you most need.
You can create additional views and apply different filters to them to view a subset of the data. It not only gives you the convenience to find the data quickly but you can create the view the way you want to.
By creating different views you can use this as a security measure to protect any data from your eCommerce or sensitive data from the users of your Analytics dashboard. You do this by creating a new view and select the filter eCommerce ID data/ access. Furthermore by creating views that filter data like spam traffic and internal traffic. Gives you the information you need to block certain IP addresses and update your lists for security. Especially if you’re getting a lot of spam emails.
Recommended Views By Google Analytics
- Raw Data View– this is the view I explained above. Untouched and used as a backup Data view.
- Test Data View– This is a place you can test new filters for instance if you are creating a filter to targeting a specific type of customer you may, later on, realize that you forgot one type. This could lead to inaccurate data. So testing the filter to see how it affects your reports is always recommend first.
- Master Data View– This is your main view where you can add in your already tested filters.
Lets Start With The Raw Data View as an example:
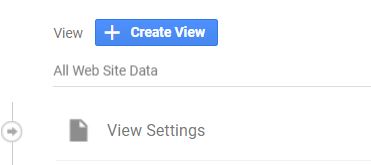
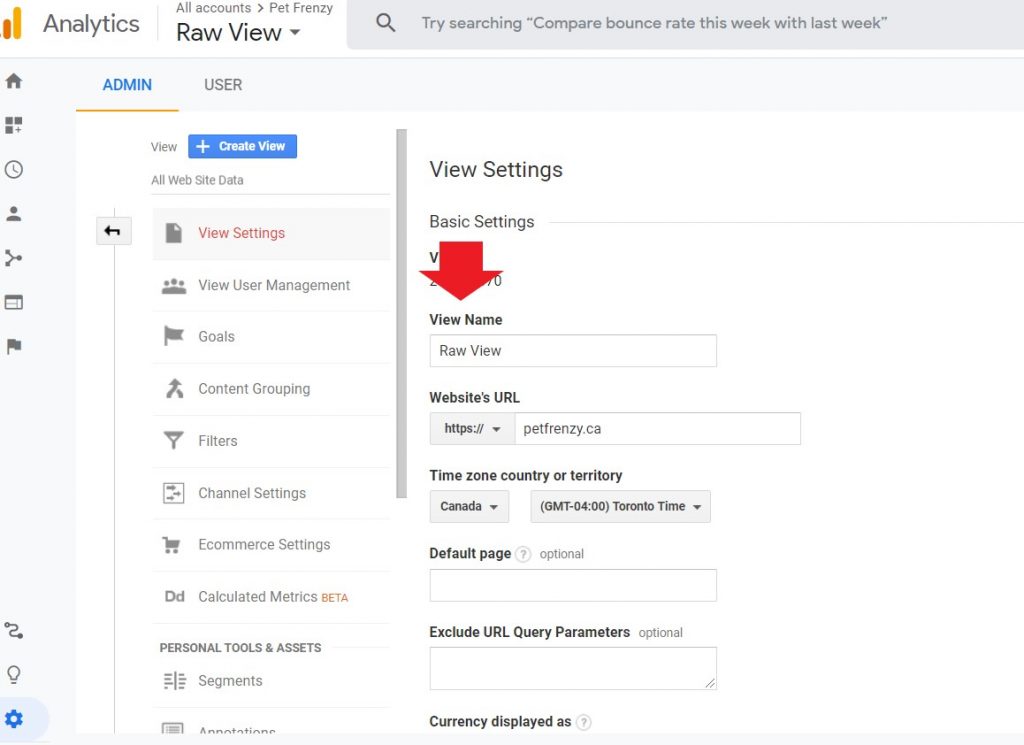
There are some limitations and stipulations you need to be very aware of. The default view is called “All Website Data” you are recommended to rename the view to match the view names that Google recommended above. So you can rename it your Raw View. You do this by clicking on the view settings/ Change the name from “All Website Data” to your “Raw View“. Do not change anything else.
The reason Google recommends setting up these 3 views right away is that only the data from the date it was created will be included in the reports. So if you set this up right away it is less likely you will lose any data. If you accidentally delete a view, you do have 35 days to restore that view before it is will be gone. *** Remember you can add up to 20 views per property.
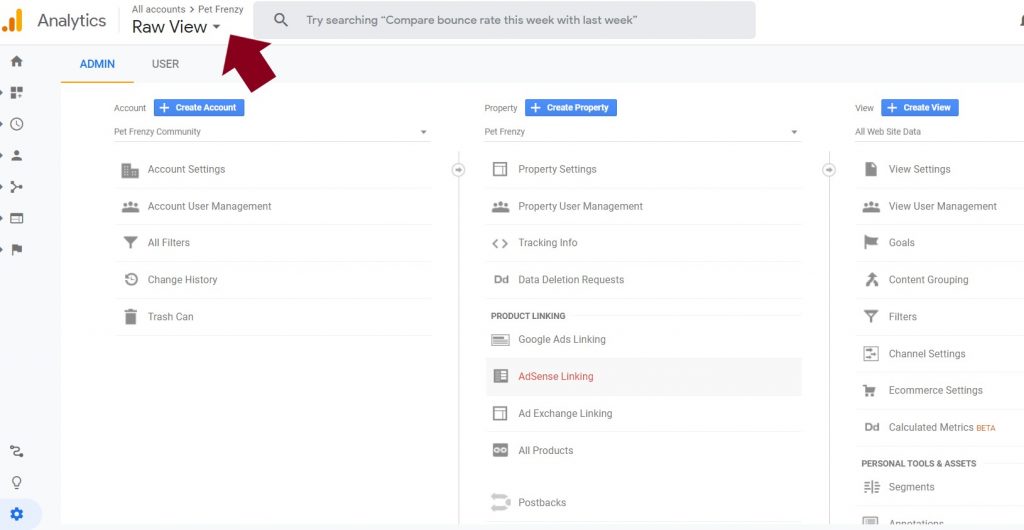
Using the Account/Property View Switcher for multiple accounts or views

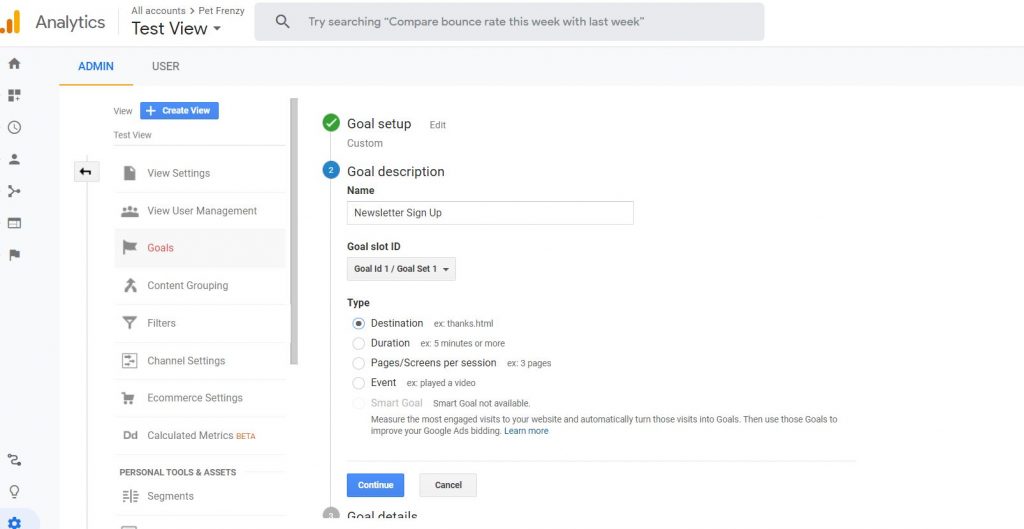
Create The Test View Next
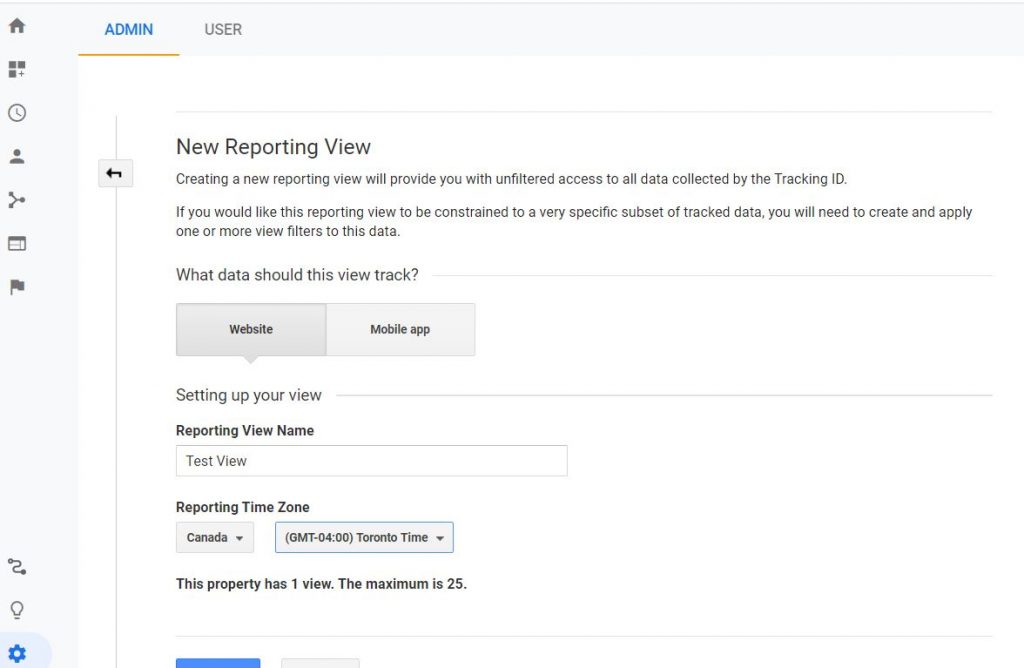
To add a new reporting view go to the Admin section of your property. Click on the Create View.

Add the View Name and Timezone. Once you are done you can click create the view.
Your master view can then be created so you can start building your reports you want. And adding in the Filters from your test view once they are tested and created.
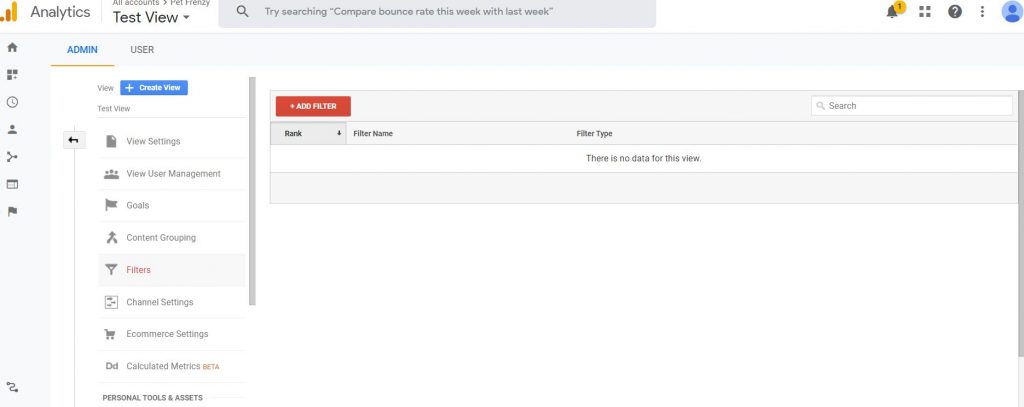
Using the Filters
So now that I have created the Test View I want to start filtering my data. For instance, we may want to exclude internal traffic. Another filter I am going to add to my test view is Filtering out any domain referrals. This can help with reducing the amount of spam traffic is included in the data. By excluding selected domains your reports will not include those URL’s in the reports or views.
You can also create a filter for geography. For instance, if your business is based US only or Canada and USA. You can create a filter to narrow the map down to even focus on regions.
We will also use the Search and Replace Filter when you want to replace product codes/names or long URLs to simpler ones. For instance, if you want to filter out the head office usage on your report then you would add the filter by clicking on the Add Filter button.
If you want to include data from a certain campaign in campaign reports you would apply the custom filter with the field “Campaign Name” and pattern like “include” or “Boxing Day Sale”. Or you can create multiple Exclude Filters with a single pattern each with the same steps.
Filters do have limitations:
It will take 24 hours before your filter is applied to your data. The order of the filter does matter to google. If you think that one filter may influence another filter you can assign them a numbered order to be in. They also cannot be applied retroactively. Doing that can be damaging to the user experience and your reports.
That is why you should always maintain an unfiltered view of your data so that you always have access to the full data set that Google has put together for you.
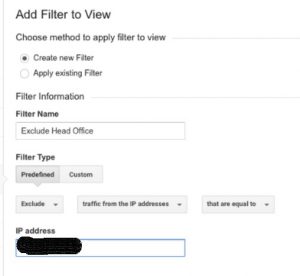
Setting Up Goals
Goals are what measures how well your site fulfills your targeted objectives. Some good ones to start with are a newsletter sign up, E-book downloads, or even donations. To create a new goal you will go back to the Admin page than Views/Goals/NewGoal.
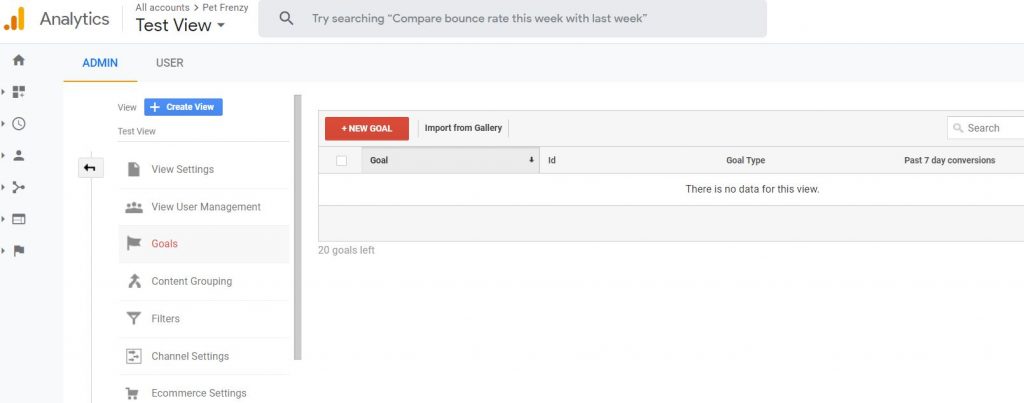
I am using the example to create a goal of my Newsletter Sign Up page.
It will ask you to enter the URL of the subscription confirmed page on your website. You will enter the URL there and then confirm that it is working.
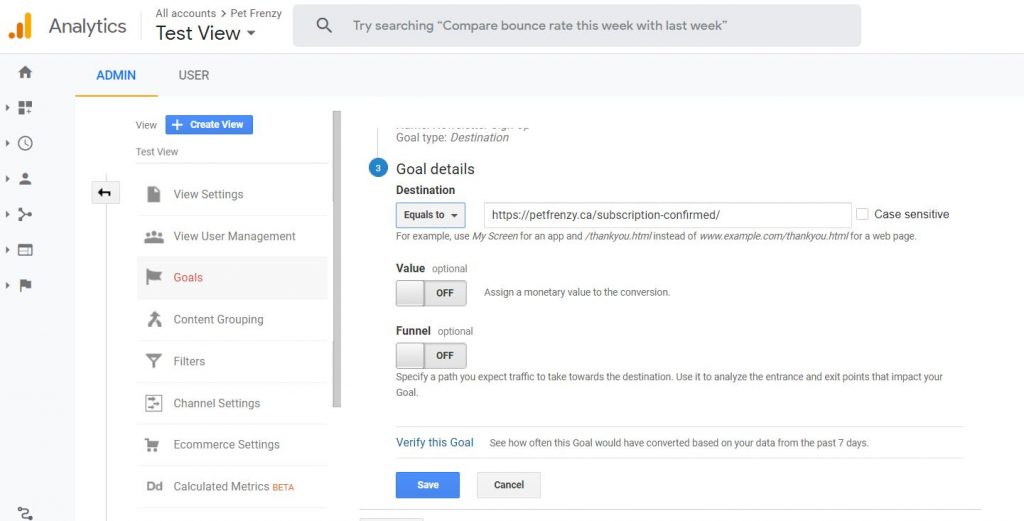
You can opt-in for adding Goal Value’s this is good if you use Shopify for example or run an eCommerce site. Turn on the eCommerce Tracking to do this. Also, you can add a funnel to the goal completion process best suited to your business. I have included a video below to help you with that.
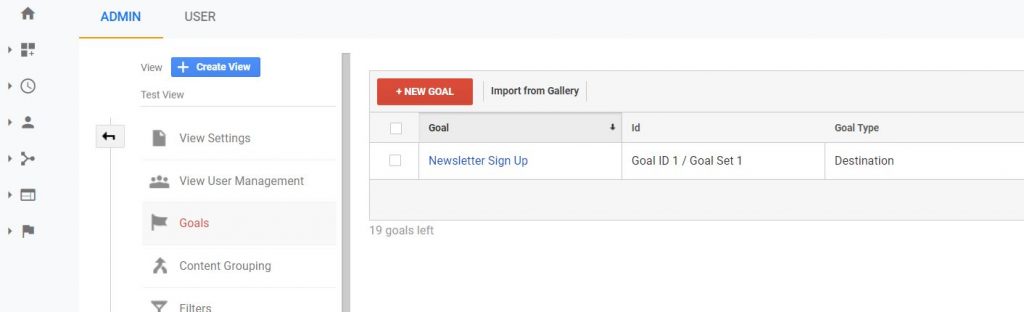
Your first goal now appears in the list.
Enable Your Ecommerce Tracking (Optional)
To do this you will go to Admin/eCommerce settings/Enable eCommerce. Once you have done that you will need to use the additional eCommerce tracking. Although, If you are using Shopify and other platforms you can do that automatically through them.
Set Up Your Google Analytics Goal Reports
Goals in Google Analytics are described as 4 Types. Destination, Event, Duration, Pages/screens per session. There are of the reports you can generate:
- Goal URL’s – Which pages your goals were completed on.
- Reverse Goal Path- The report gives you the three steps a user took prior to completion of the goal.
- Funnel Visualization- This report takes the Reverse Goal pat a step further giving you the drop out vs success rates of the conversion.
- Glow Flow- It is actually the improved version of the Funnel report. You can add segments into this report which we discuss later on in this tutorial. It can also show the visitors that skipped certain steps so it is a valuable report as well.
Some Limitations with Goals
They will tell you that you are limited to 20 goals per reporting view. They can not be deleted, but you can edit them or turn them off. If you wondering a conversion is the completed activity like someone signing up for your newsletter. If the user signs up more than once this will be only counted as one conversion not more than one.
You can set up event goals tracking only the clicks to call to action, but you do have to set up event tracking. Smart Goals is another one you can choose from. This will allow google ad advertisers who may not have enough conversions to use the Google Ads tools.
Learning to Navigate around Google Analytics Dashboard
It is very important you get to know the way that the dashboard is set up for Google Analytics before proceeding. Especially if your just a beginner. If you are more advanced you can scroll down to the next section of the tutorial.
As I showed you above there is the Account/Property/View Switcher.
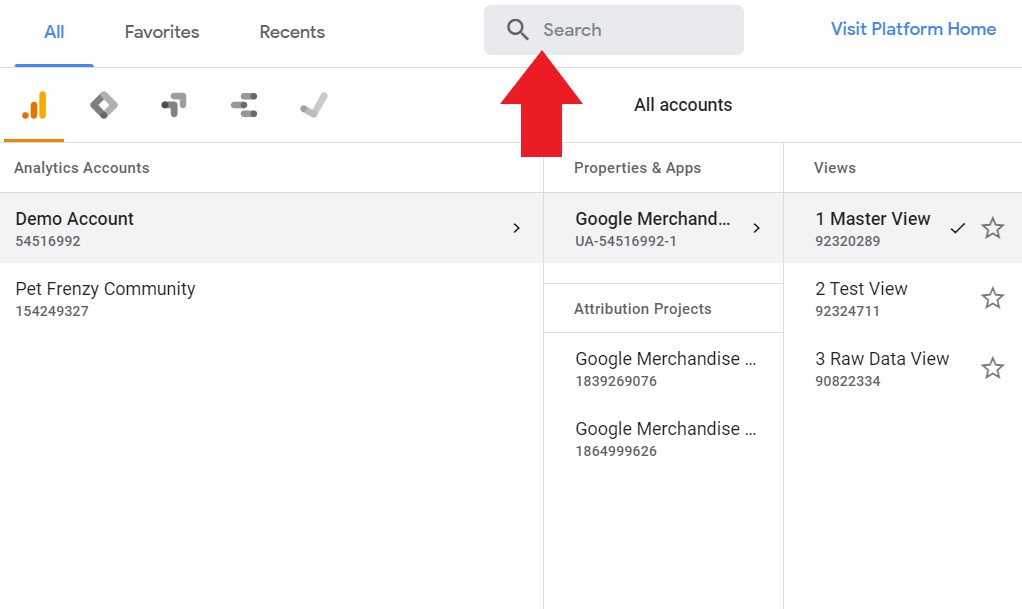
You can easily set up new views or change property views with this tab. Switching between them at any time to view your reports. You may need to use the search box to search for certain reports or settings. You can use the search box that the dashboard provides when you use the Change Property View Tab.
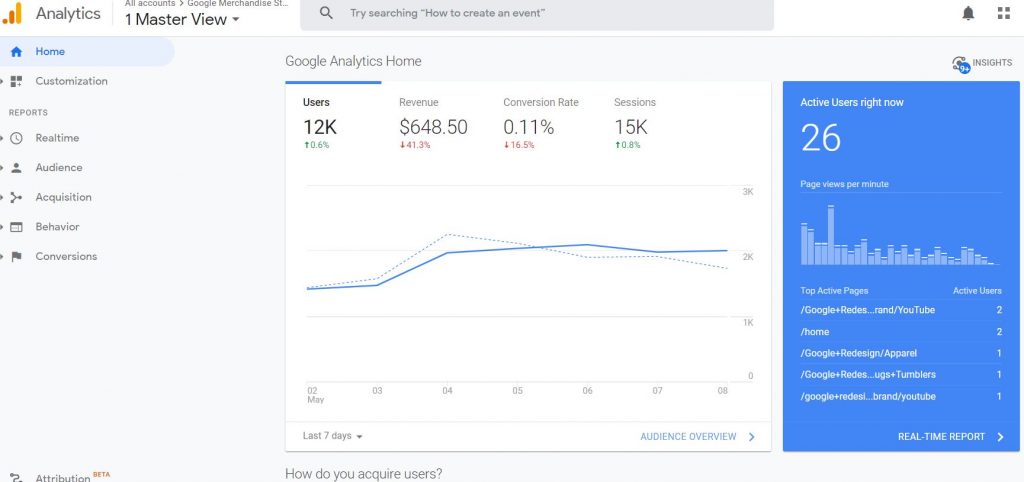
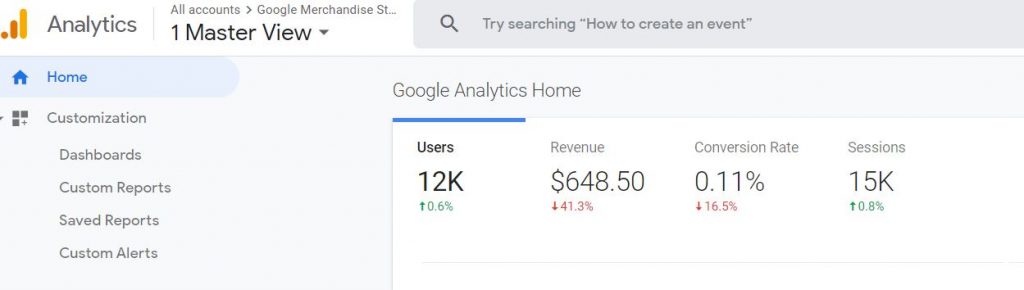
Home Menu
This will give you the home page with all your gathered report information. It includes the following:
Customize Your reports
With this tab you will be able to customize all your reports and dashboards.
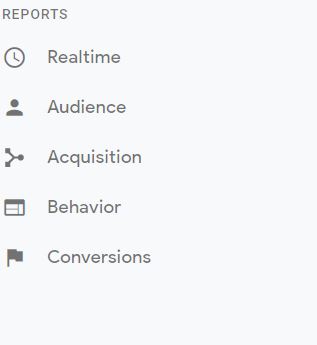
Google comes with over 100 pre-customized reports. It is from this tab you can access any of those. They are divided up into categories: Realtime, Audience, Acquisition, Behavior, and Conversions.
Realtime is what is happening on your site at that very moment. It can give you details on what region, what the landing page is, and more.
Audience is the report that gathers characteristics of your users.
Acquisition is reports that show how your visitors landed on your site.
Behavior reports that provide behaviors such as entrance and exit pages used to access your site.
Conversions, as explained above, will give you the report on any completed activity such as a subscription or payments.
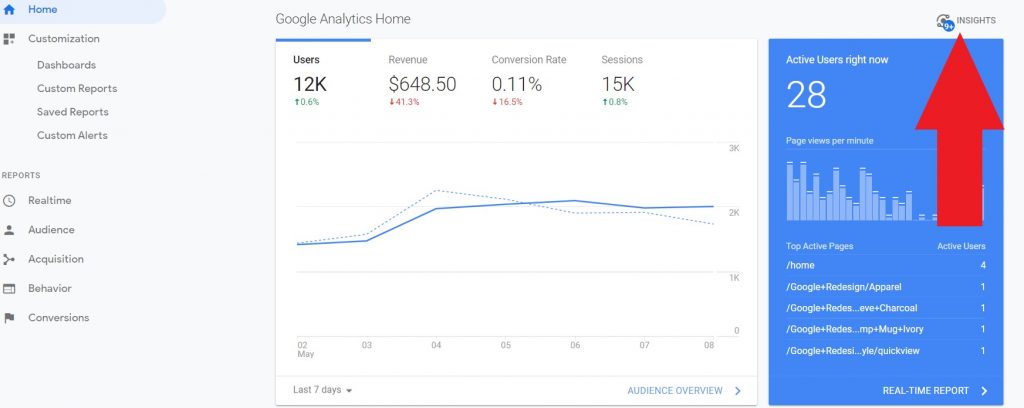
Another Great Feature on Your Dashboard You Don’t Want to Miss
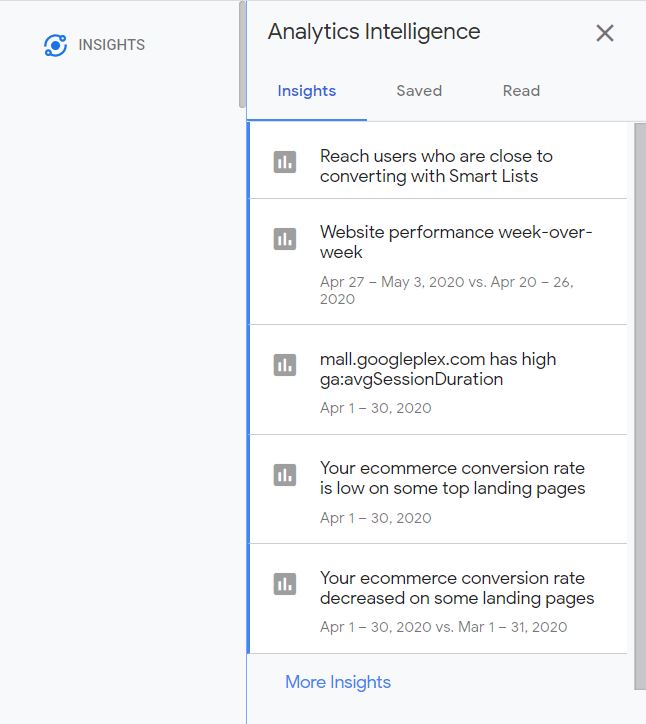
If you notice the top left corner has an icon called Insights- Analytics Intelligence. If you click this it will give you suggestions and tips. Performance reviews. Also, it will give you the information you need to act on your data, it is a very powerful tool. You can also type in real questions and get answers to them when you need help. You can save them for later as well. I love this tool.
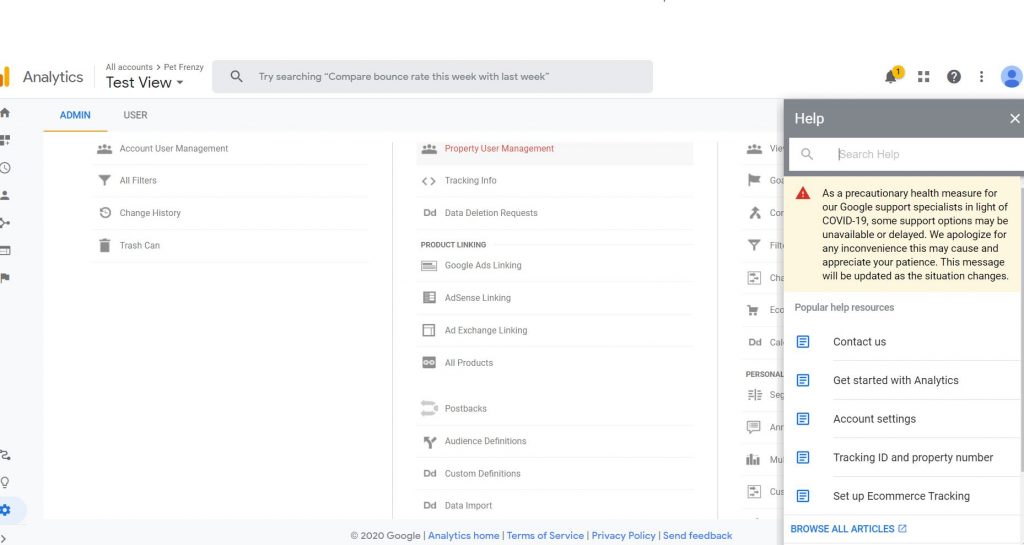
You will also see the Help question mark in the top left corner of your screen.
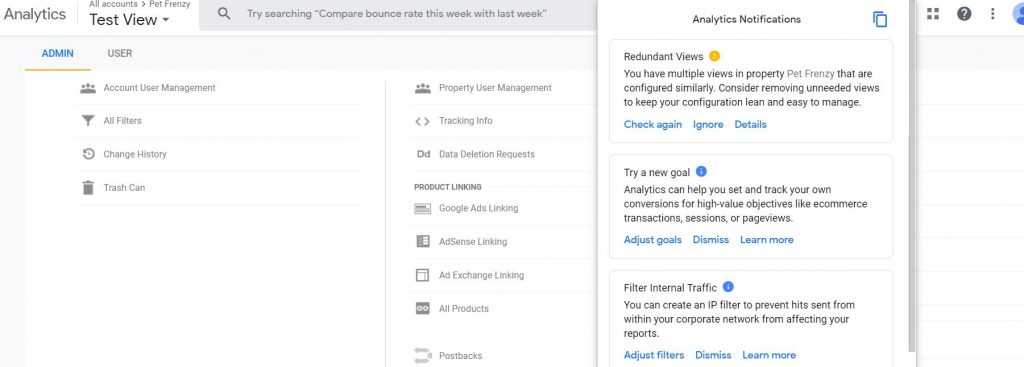
Notifications such as these:
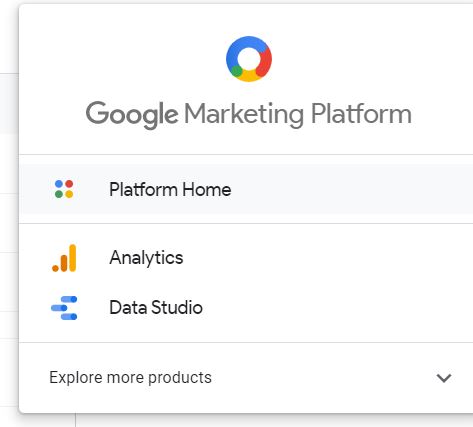
there is also Google Marketing Platform where the squares are in the top left next to the notifications.
Main Tools You Will Be Using In Google Analytics and Where to Find Them
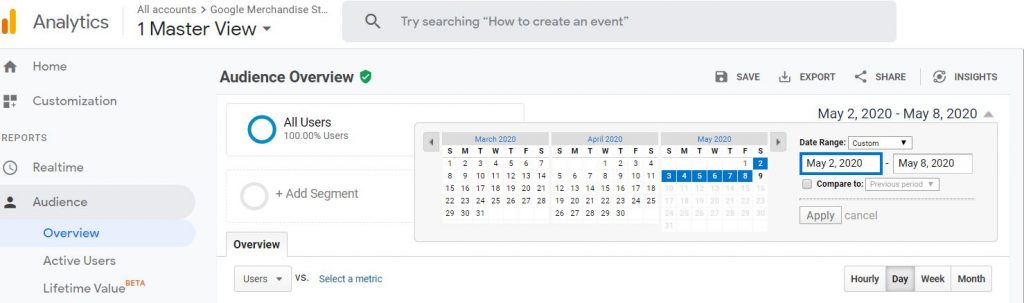
The time period you want to analyze your reports can be found on the menu Audience/Overview. You will see a date range and you can change that to what you want at any time during viewing.
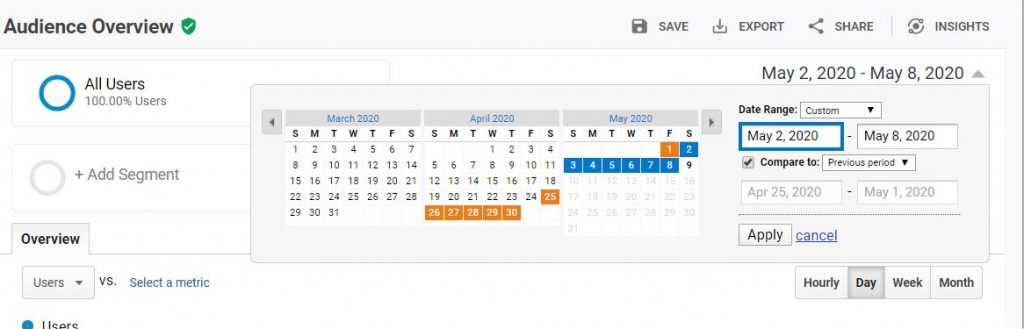
Click the compare to box to analyze the comparison of last week to this week for just an example:
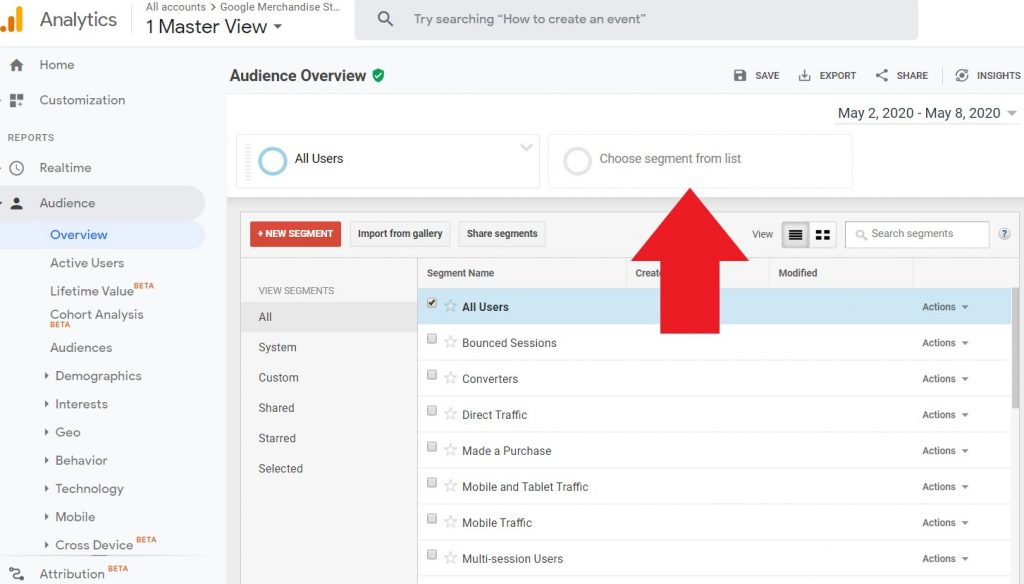
You will always have a tab option for your reports to add in Segments which we will be discussing later on. If you click on this you can add segments in at any time to any report to compare data to subsets of the data. For instance, it will allow you to isolate and compare various groups of users on your website.
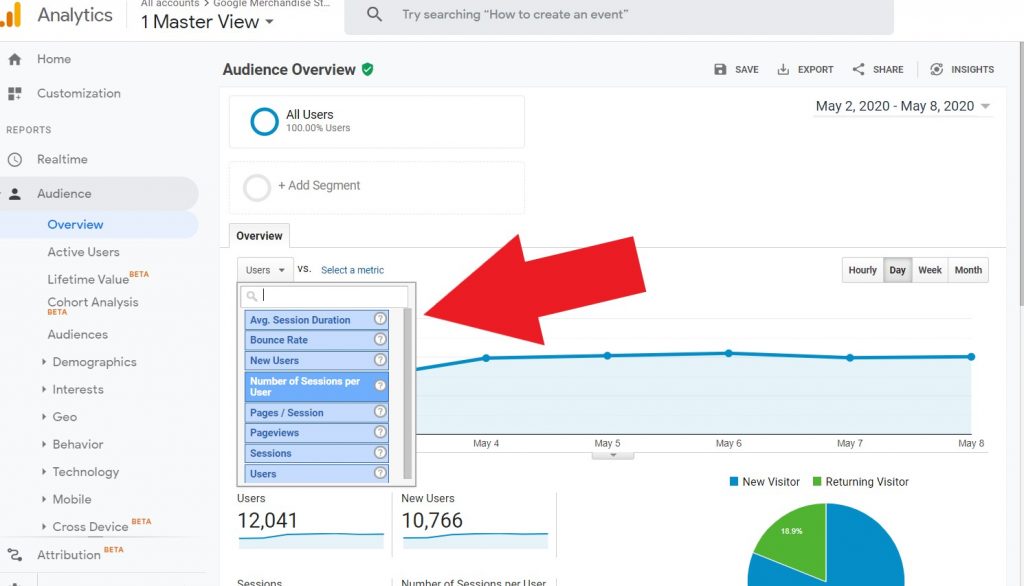
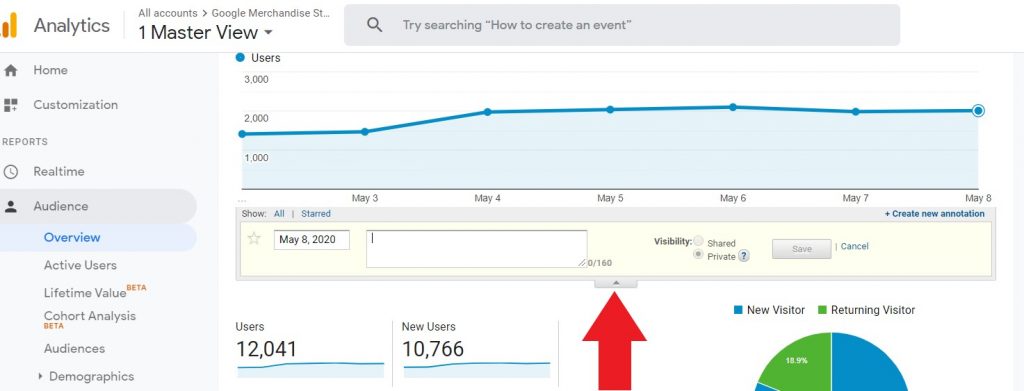
You can also select a metric in which the report is measured. This can be found in the line graph in the report. This next section allows you to add annotations or notes if you want to. Just click on the grey bar arrow and this will come up allowing you to add in an annotation. For example, if one of your marketing campaigns do really well you may want to note that for further planning for your next one.
One I would like to show you is the precision or faster response option:
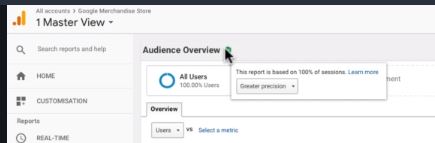
This gives you the option to speed up the data on the report or use precision for more accurate but delayed report. This will be discussed later on in our more advanced section of the tutorial.
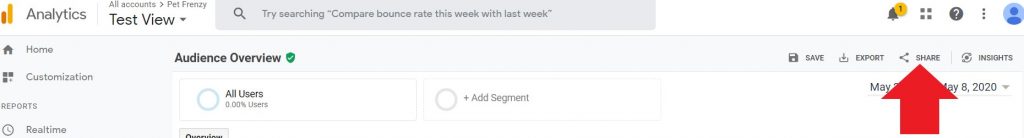
You can also use the tools in the top left that allow you to share or export if you need to. For instance, you may have a call to action button that your client wants information from. You can easily click on the Share button to share this with other colleagues or customers.
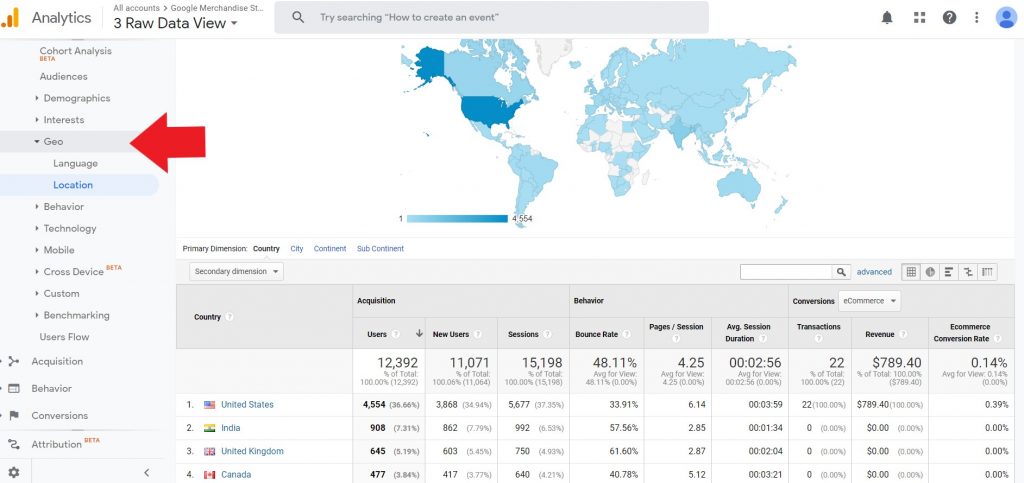
The Geographic Location report is another one I want you to look at.
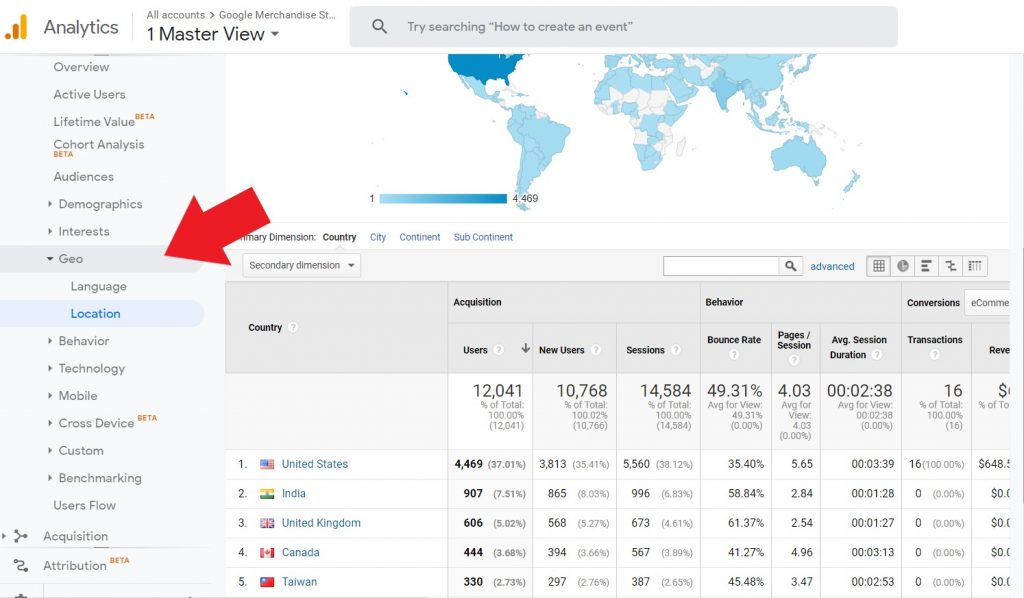
Google will refer to the country as dimensions. Dimensions are attributes such as different cities or regions where the data originates from. With these, you have Acquisition, Behaviour, Conversions. In order to get this, you will need to set up goals or e-commerce tracking. This is where you can manipulate the chart to view top countries by revenue or sessions etc. Also, use the drop-down box to choose the goal you would like to view in the data table. If you want to change it back to the original you would just click back on the Users button.
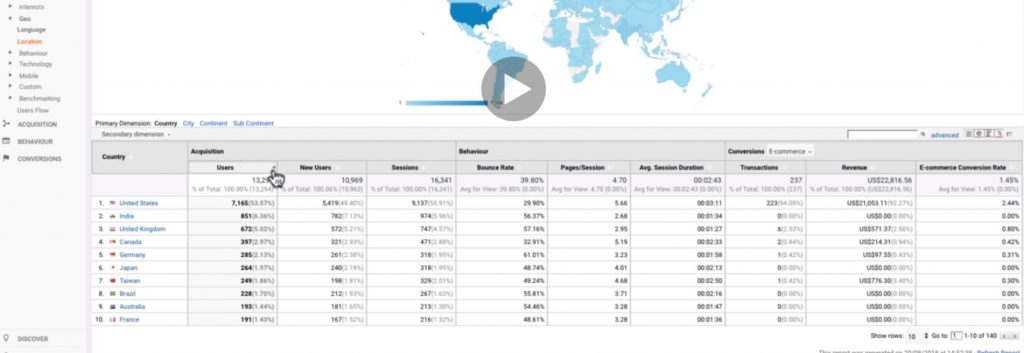
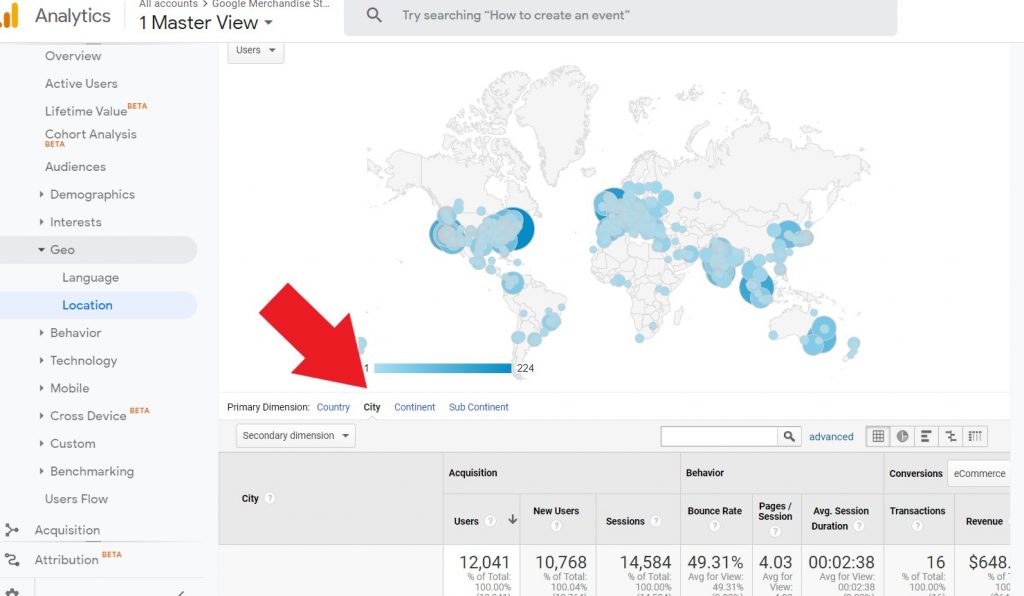
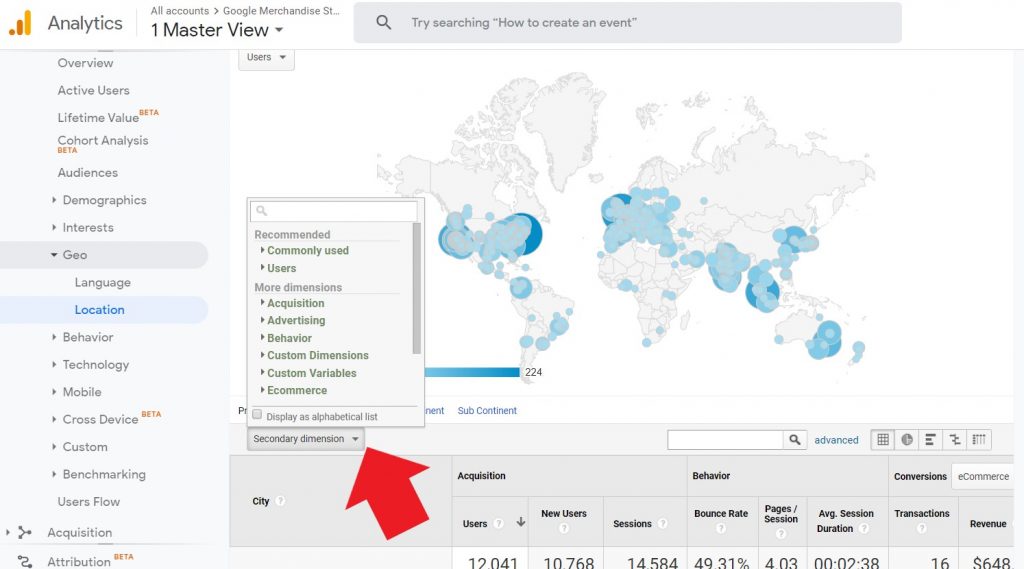
You can choose to narrow your view to the Country, City, Continent, Sub Continent as well by clicking on tabs above. You can also include another secondary dimension such as a specific area.
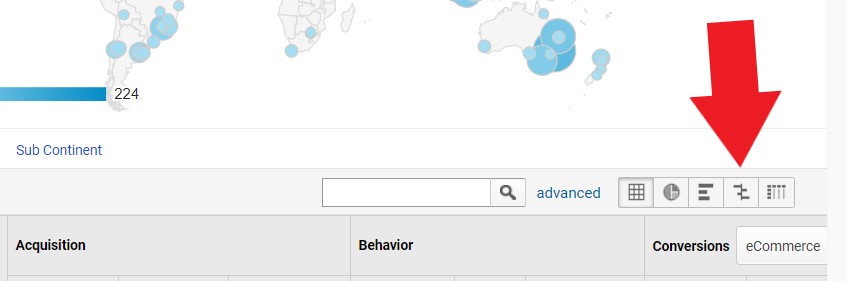
View these reports as a pie chart, pivot table, comparisons, etc. The default is a chart, you can change the view by using these buttons.
How To Analyze Your Reports
Some of the reports I am going to go over will be the ones you will most likely find yourself using the most. We will look at them one at a time:
Audience Reports
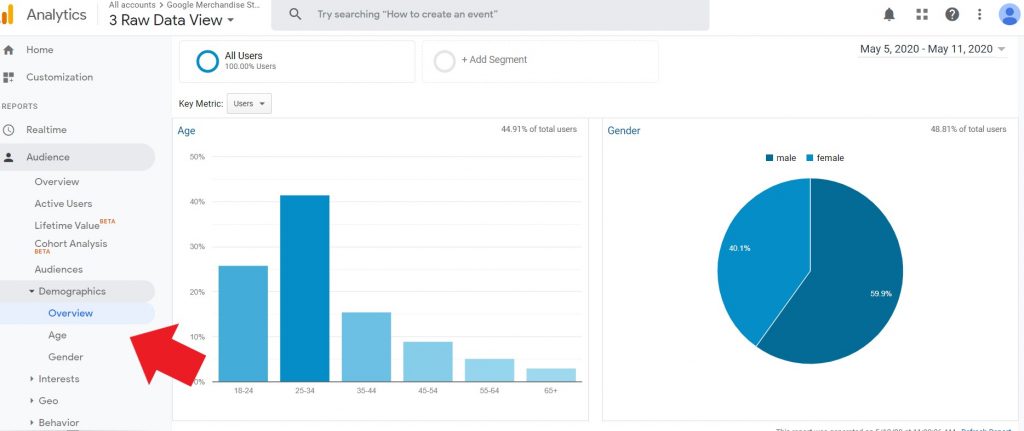
These help you understand your audience’s age, gender, location, and interests of your most valued customers. You can then send them content that will be pertinent to their interests. You can also use the Audience report to expand into new markets, Especially where you are getting a lot of traffic to your website.
By reviewing your audience reports you can fix any technical issues that are making your bounce rate high. Thus lowering your bounce rate on your page. This really helps your SEO score and google ranking. If you want to build an app, later on, you can use Google Analytics mobile report to help you with planning the development by knowing your audience. Here are the main Audience Reports you will be able to generate and where to find these reports:
If you go to your Audience on the sidebar, when you click on it you will see a drop-down list like this:
Audience Reports
Demographics
Interest Report
By clicking on Interests you will see another drop-down menu. If you click on Overview you will see a screen like this one:
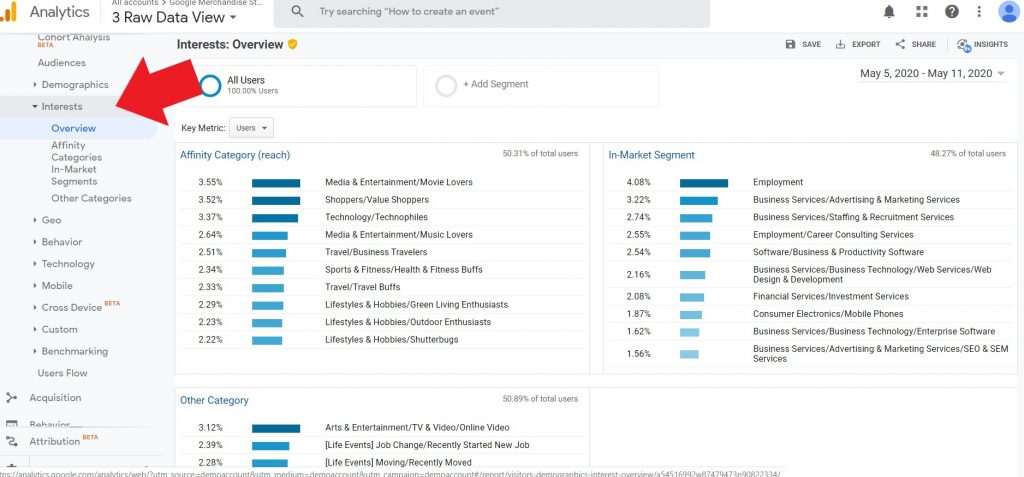
Now you can see the interests of your viewers. If you click on other categories this is where you really be able to see the overview of all your categories that users are using to access your website.
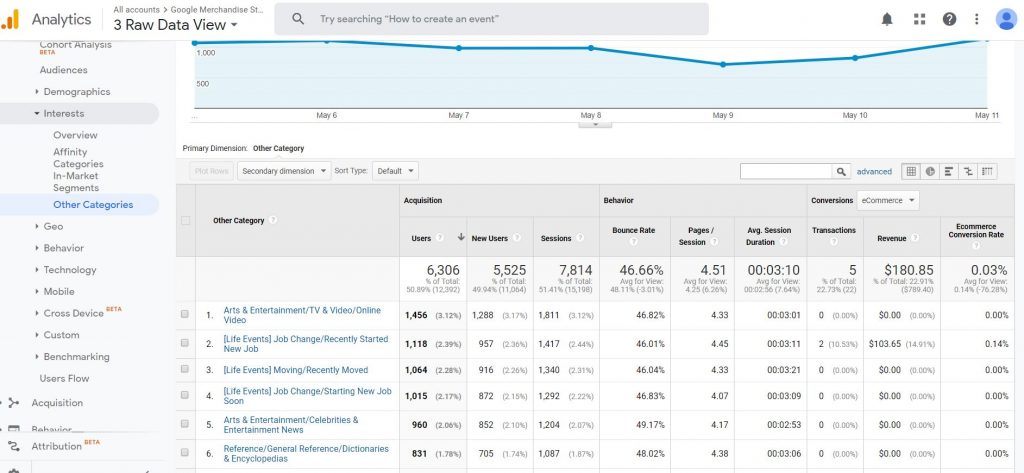
You can click on any of the titles in the chart, for example, if you click on your Bounce Rate and notice that it is almost 100%. You may want to look at the accessibility from that page. Your Bounce Rate is important because it will tell you how long users stay on your website or page.
You want to keep your bounce rate low preferable in the 50-70% range. This will allow you to track what the problem could be with your marketing campaign or more.
Geo
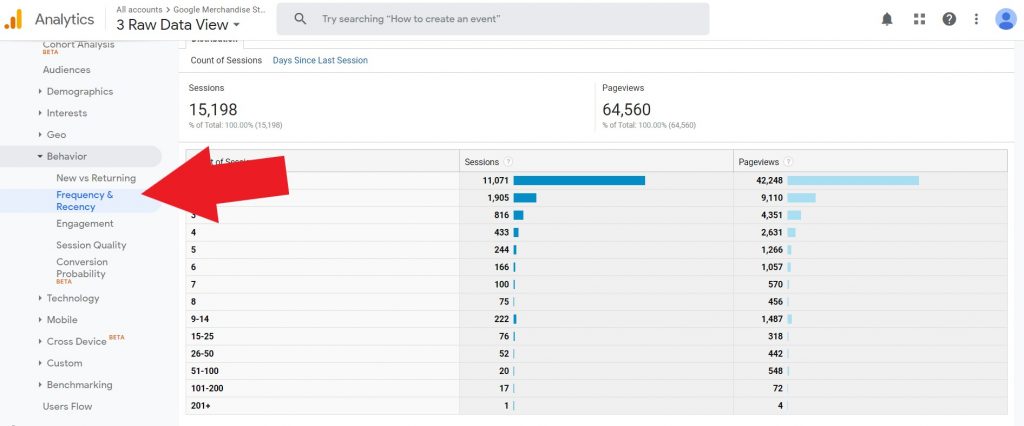
Behavior
This report allows you to view the New Vs Returning visitor, The engagement your viewers have with you website, and more. This is an example of the frequency and recency of the viewers:
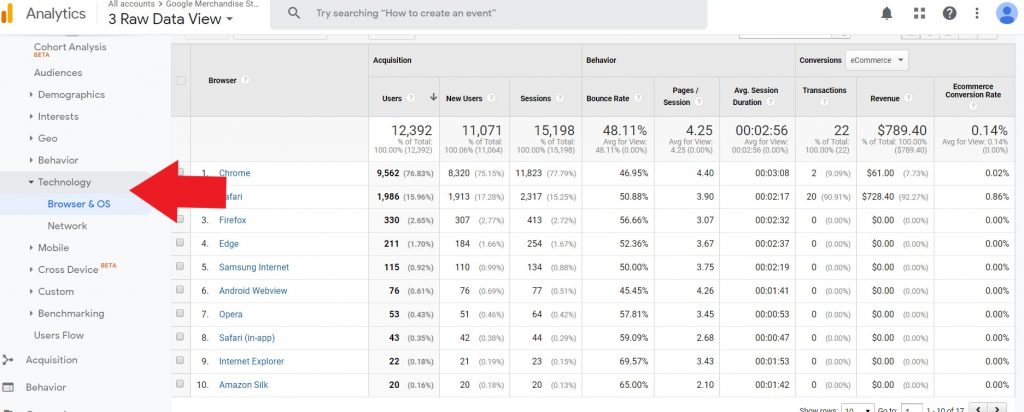
Technology
You will be able to view which browsers your viewers use in this section as well as the different networks used.
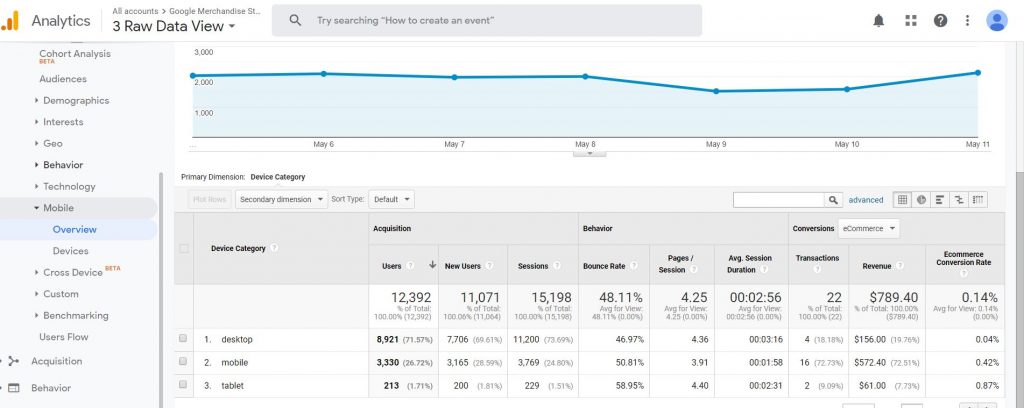
Mobile
This report will tell you the type of device such as desktop, mobile or tablet users.
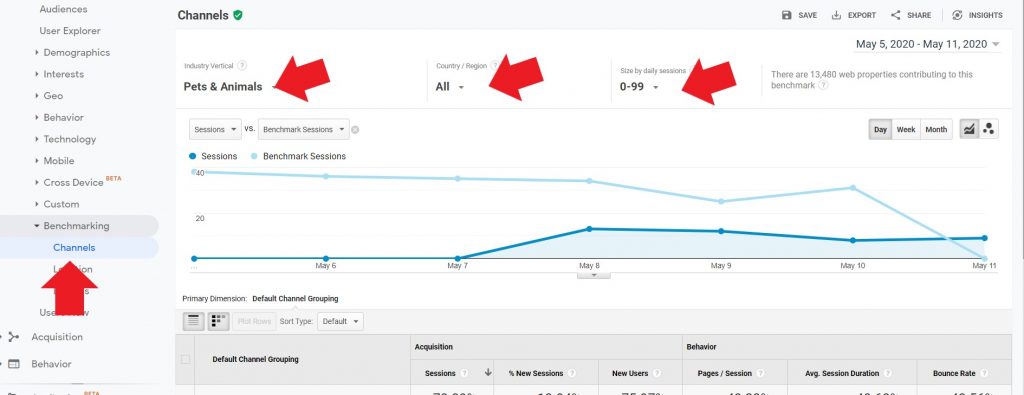
Bench-marking (Compare your performance with your competitors)
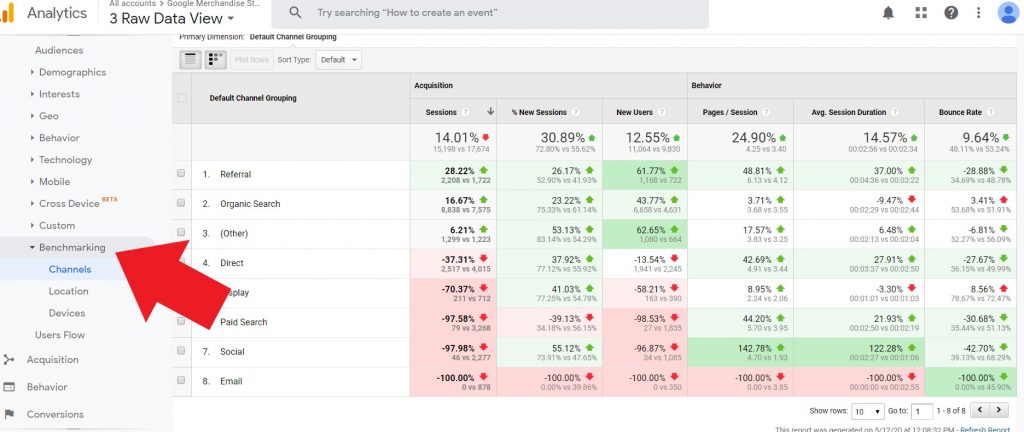
This will help you compare your data to that of your industry with your competition. On the top of the Channel report you will have some options to compare to that your industry specializes in:
Important Information
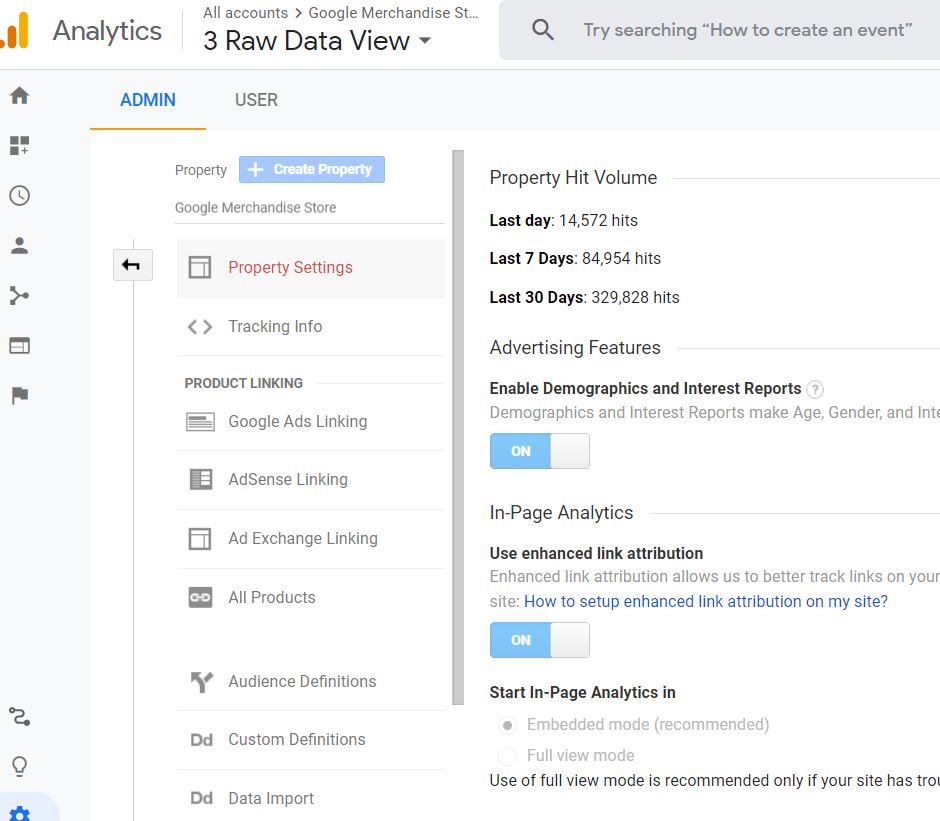
In order to use the Demographics and Interest Reports, you must first go to the Property Settings on your Admin Page and enable Advertising Features. If you use this feature you must have that in your Privacy Policy on your website.
Acquisition Reports
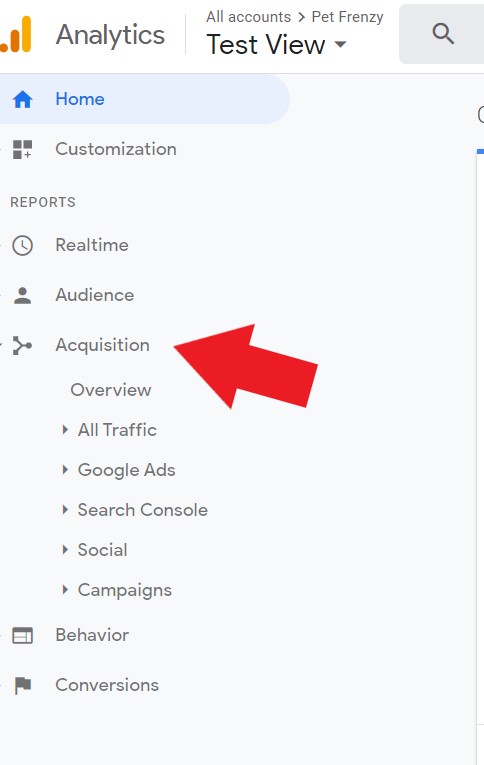
As you can see the Acquisition reports have an overview. You can also see that you can find more detailed information under this, All Traffic, Google Ads, Search Console, Social, and Campaigns. The benefits of using this feature are comparing the performance to other marketing channels to see not only conversions (Conversions are the completed activity as mentioned)
You can also identify things such as budget gaps, your return on ads from social media, and you can find your traffic sources. For instance, you can see who is referring to your website and build future relationships with them. Or even seek out other similar websites who are more likely to refer you.
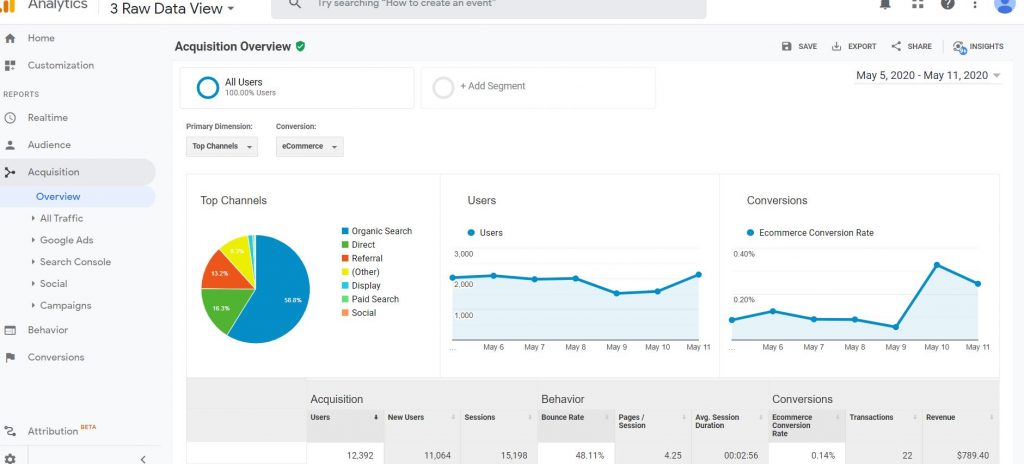
Overview
This report will give you an overview of Acquisition, Your top channels, and conversions.
All Traffic
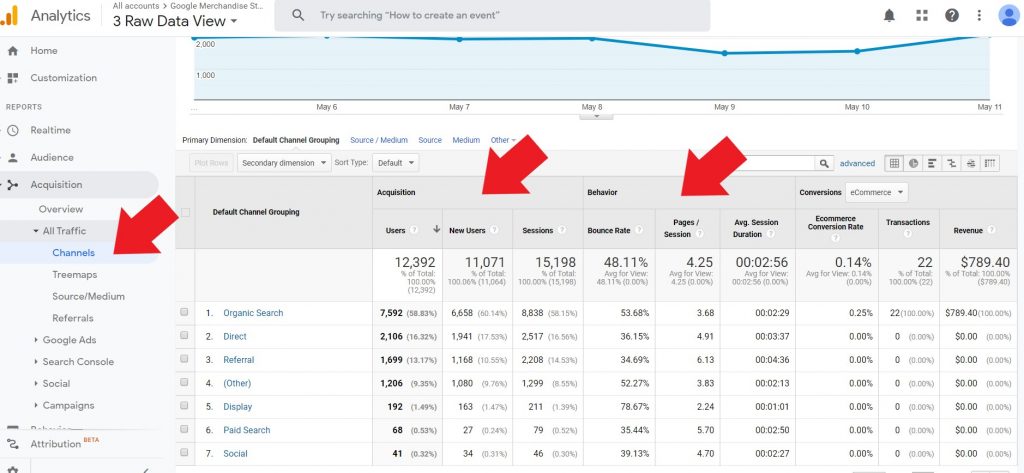
Channels
This report tells you what channels are used such as organic search, to social referrals. You can see then how many users, sessions, and more. By using this report it will help you better understand who is directly searching for you or who is referring you. If you are using paid ads for your business. This report will be able to tell you how effective those ads are.
Source Medium Report
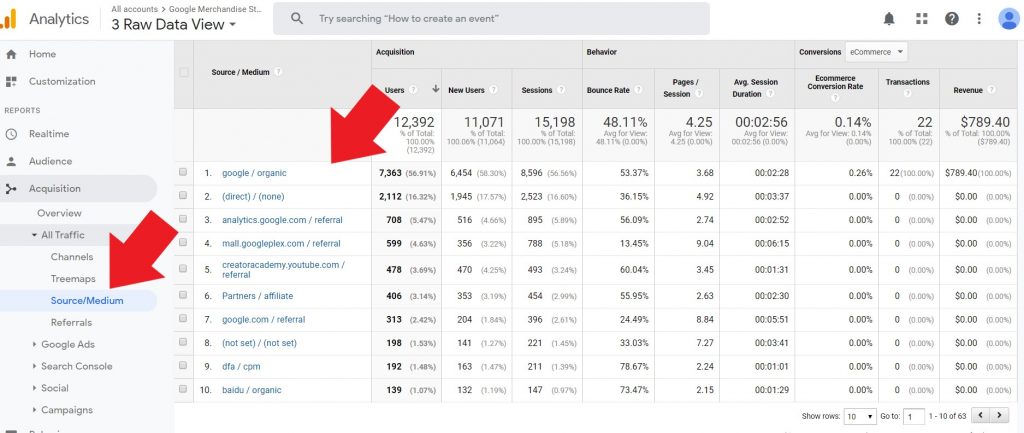
The source is the origin of your traffic. Medium is the general category of the traffic source. This could mean inbound links, cost per click, and so forth.
Referrals
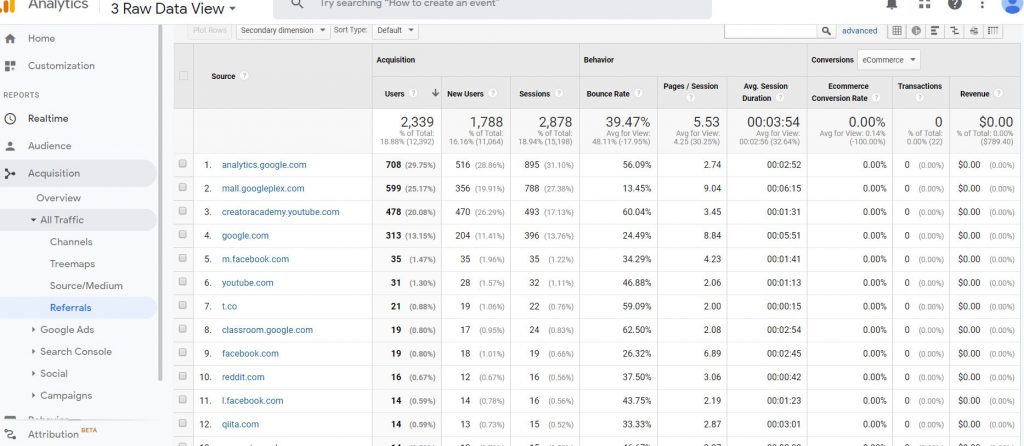
A referral is when a user clicks to your website from another website or platform. This list will give you that information. The report will leave out search engines and organic searches.
Benefits of Referrals
So if you want to see where your referrals are coming from, this is a great place to start developing relations with others. This is important for places like animal rescues or shelters. If they see they are getting a lot of donation traffic from a certain website. Reach out and do a specific campaign together to raise more funds for your animal shelter.
Now you can look for similar sites that will help refer traffic to your website. We will be discussing the other options for Google Ads and Search Console in the more advanced section of this post.
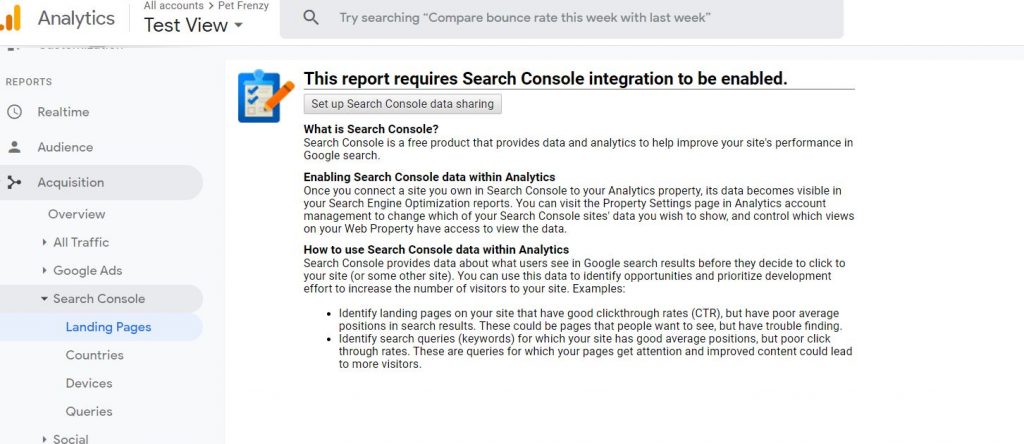
After this is set up you will be able to view the landing pages the most googled keywords that help find your site and much more.
Social
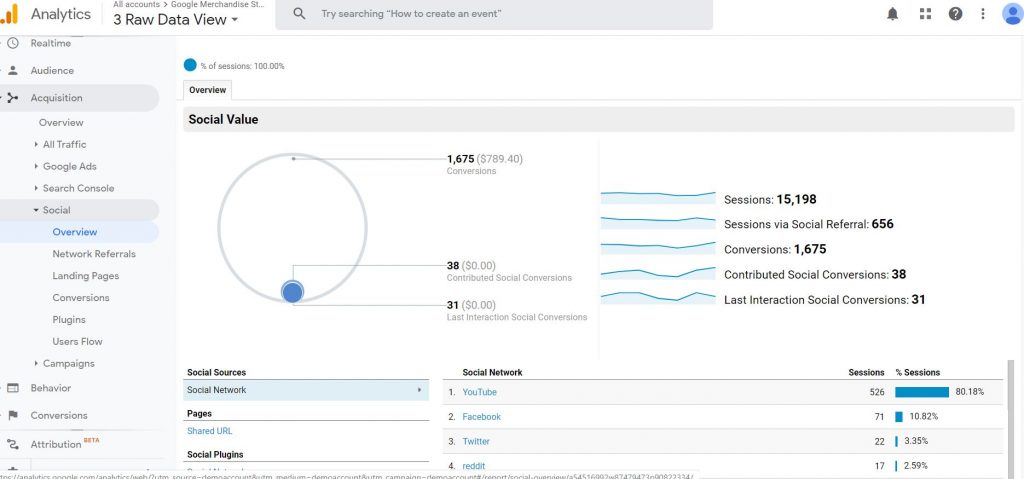
Your social overview tab will give you information on the value and social sources that direct traffic to your website. For Instance, you can see if U tube is doing better than Facebook.
Limits to Acquisition Reports
Google does have some limitations on these acquisition reports much like the others. However if for some reason Google can not identify the source of traffic it will be added onto the direct channel and appear in the source/medium report as direct/none. By using the Campaign Tagging it will reduce the number of direct/home traffic on your reports. I will be discussing this further later on in this post.
Behavior Reports with Google Analytics
Reasons why behavior reports are important for growing your business. These reports allow you to find new content ideas, by seeing what topics drives the most traffic. make a better impression of your website or business. Reducing bounce rates and increase conversions. This is especially important to know if your advertising campaigns have paid off when using paid advertising. You can also identify unwanted exits to pages that people are leaving your website.
Furthermore, you can increase your website load speed. If pages are not loading fast enough. The user will leave, we are all guilty of that one! I know have chosen a faster loading site over a slower one many times. Try to keep your pages loading speed to 1 second. You can do this by using a service called cloud flare. It is free and sometimes when your website isn’t loading fast enough. One of the most common reasons is the server is too far away. So to eliminate that I would recommend CloudFlare. These reports will help you recognize if there are any loading problems.
All Pages Report
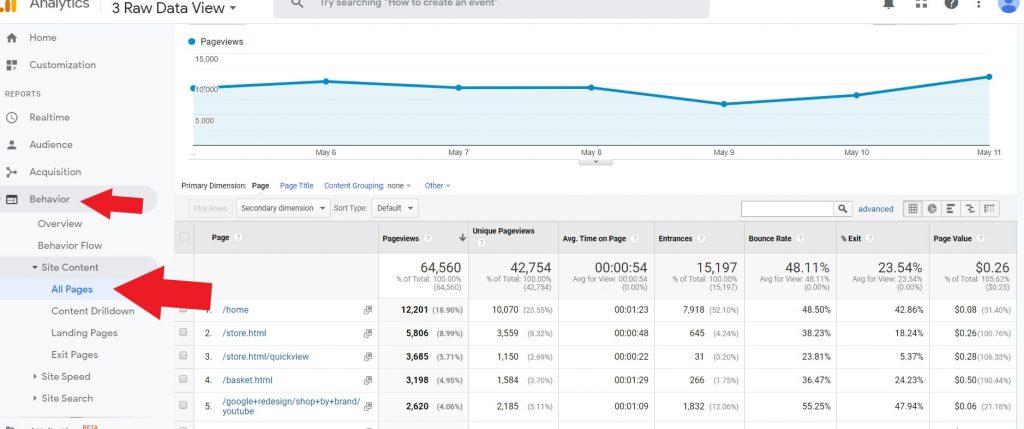
This is where you can see where the pages that get the most traffic are for future content decisions. I will go over the content drill down later on in the advanced section of the post.
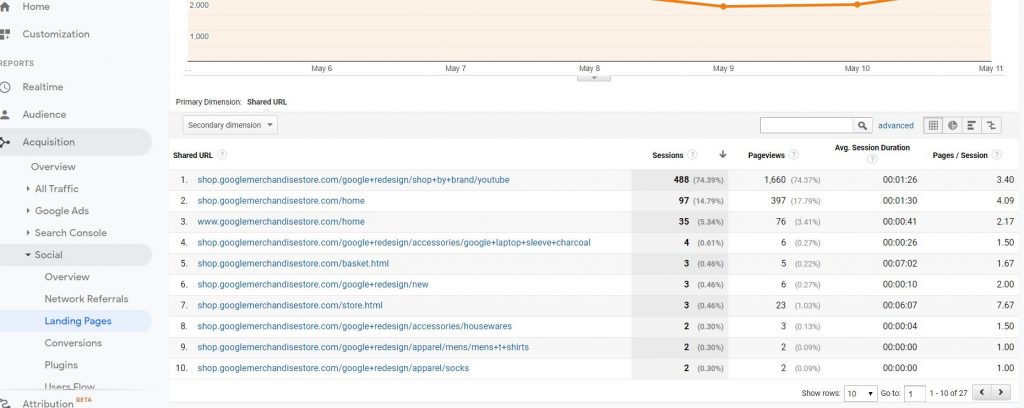
Landing Pages Report
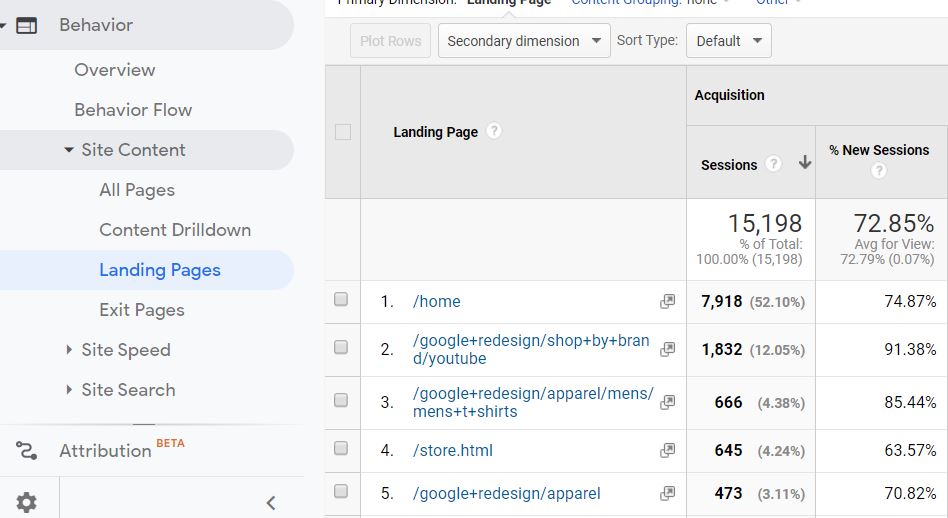
You will actually want to look at the bounce rate on these pages. If the bounce rate is high, than you may want to investigate further why people are leaving the page right away. It could have something to do with content relevancy, or slow loading time.
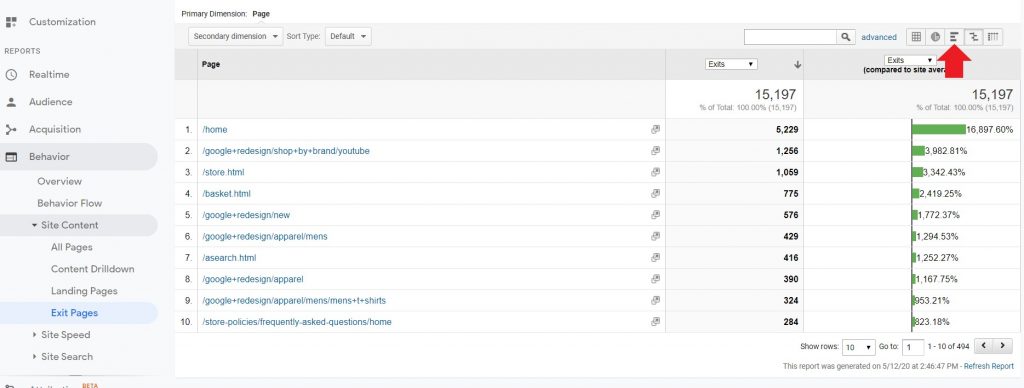
Exit Pages Report
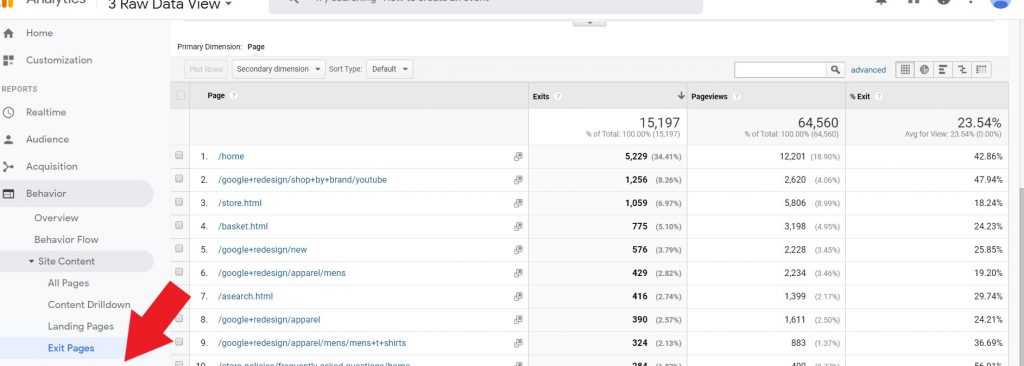
These are the pages people have exited your website from. You can also use the site comparison tool to view site average compared to others on your site. Use your top-performing pages to learn from and improve the rest.
Site Search Report
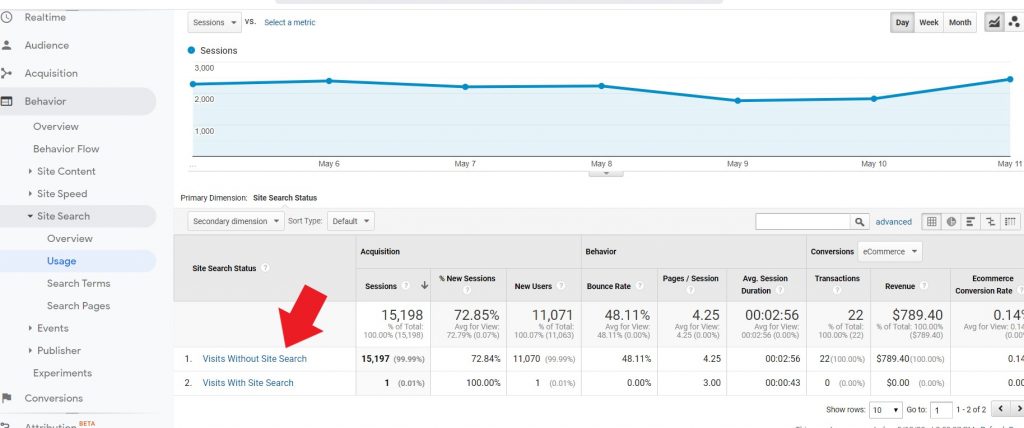
This tells you how many people are using your site search and what they are searching for such as terms and pages.
The Google Analytics Dashboards
Dashboards are an overview of the reports and metrics you want to focus on the most. By setting up your dashboards you can monitor all your metrics at once and quickly. Comparing the reports can help you understand your metrics differently than clicking them one at a time. By creating different dashboards, you can have roles use certain ones. Accountants for forecasting sales, to your editors or marketing department. They are easy to create and customize.
Google allows you to import dashboards from the Google Analytics Demo Account or Google Analytics Solution Gallery.
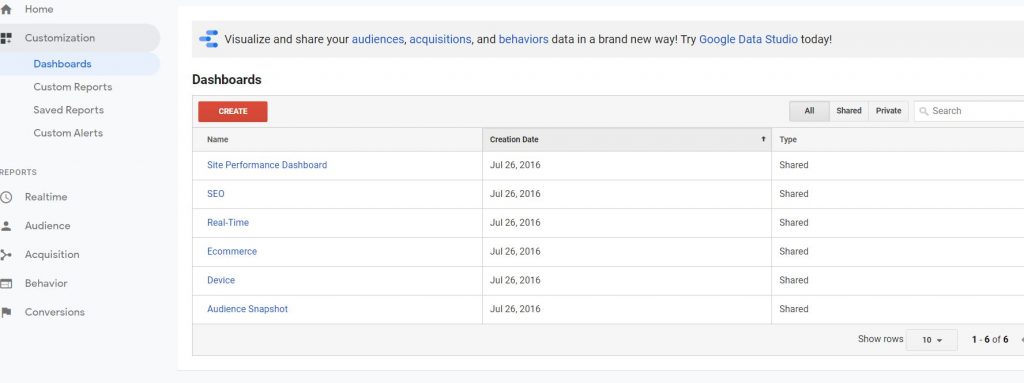
To create a new dashboard you can go to Customization/Dashboards/Create
Here is an example of a Site Performance Dashboard that includes loading time and all information to viewing any performance issues very quickly. This would be a great dashboard for your technical team to view without having to view blog pages or other stuff not pertinent to them.
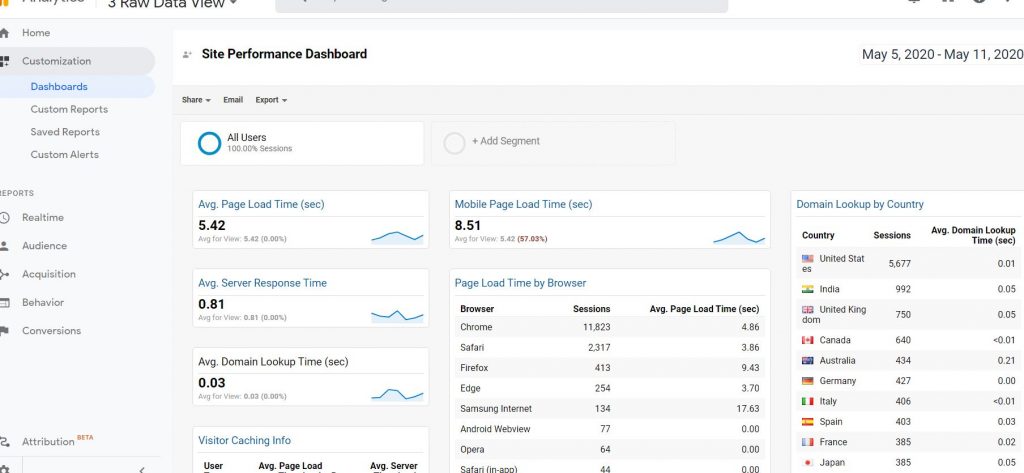
When you create a new dashboard you will be prompted to add your widgets you would like to add to the dashboard. You will notice there is a share button beside the email or export to pdf. tab on the top of the report. This allows you to share the report with other colleagues. Even allowing to share into the solutions gallery with one click. However if you do share with the gallery, viewers will not see your information only the template you have created.
Limitations to Dashboards
When creating dashboards you do have a limit of 20 per user. Each dashboard can contain up to 12 widgets you choose.
Campaign Tagging
Campaign Tagging in Google Analytics is a way you can determine which marketing or advertising campaigns are getting the most traffic. You should know that by default Google Analytics is not able to identify your different campaigns you may have. It can however help you identify the source it is coming from. By Campaign tagging you can overcome this issue.
This can be critical in running an email campaign which for various technical reasons they won’t be counted. So to overcome that you can use the tagging. Otherwise as discussed above it could end up in the direct/none.
Running paid campaigns outside of Adwords, those visits may go uncounted as well. You will need to go into your Adwords to make sure those campaigns are not auto-tagged disabled. Or they will show up as organic visits rather than your active campaign. You can find all your campaign reports under Acquisition/Campaigns.
How to Tag Campaign Links
Open the campaign builder. This is the screen you will see. You will need to fill in all the information to create your campaign URL.
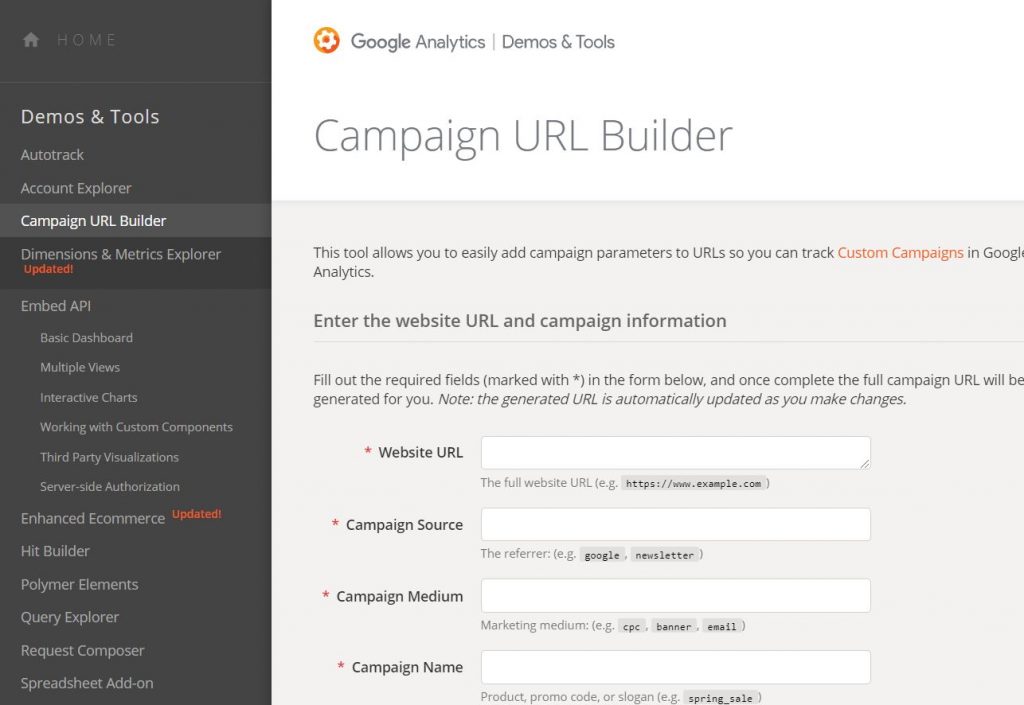
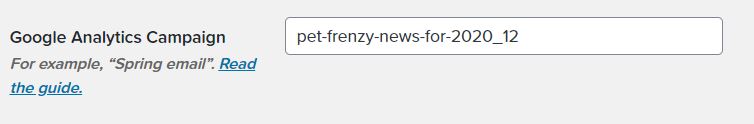
You will want to add the campaign tags. Medium, Source, and Campaign are required. Content and Term are optional. For instance, if you have an email campaign you will add in the newsletter tag from your newsletter settings page. I use MailPoet and in the settings, it will allow me to choose a campaign name to use.
Once you have added in the campaign tags you can copy and paste the link that is tagged into your email, Facebook post, etc. Just as you would a normal link.
Adding in Facebook Post is exactly the same method. Once you paste the link you have chosen to create the campaign. You can preview it and move to the next step. The link will not appear in the Facebook post. Only for tracking purposes for your campaign.
Understanding what the terms mean in campaign tagging
Medium is how you sent your message to the viewer/user. if you want you can label that “email” or “social” for Facebook or Pinterest. I would use something like cpc for paid search ads.
Source is where the viewer/user came from. Could be newsletter or workshop.
The campaign is the name you are choosing to track. for example v5-50dollars-off. or v1-promo. V standing for version.
Content is used to differentiate different versions of your campaign.
The term is only used if you’re manually tagging a paid search or a paid search campaign from search engines like Bing.
You will need to wait 24 hours after setting up your campaign. Then you can go to Acquisitions/ All campaigns.
You will want to enable auto-tagging for google ads. Manual URL tagging should not be used for google ads. You can link your google ads account from the settings page. You can do the same with email as I described above. This way links that users open in your newsletter won’t be uncounted. Using any Facebook ads can be tracked through Google analytics as well with this method.
Linking Your Google Ads to Google Analytics
When you go to the Admin/Settings and you have linked your google ads to analytics. You can enable the Auto-Tagging. You can add special campaign tag (=gclid) to your google ads URLs by using the auto-tagging feature.
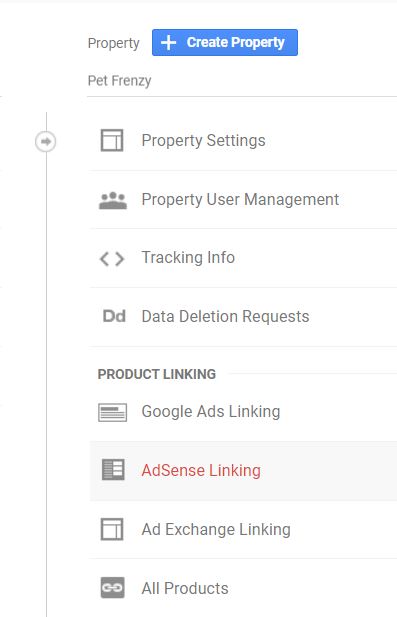
To configure you will need to go into your Ad-sense account Then you will be able to see all the information on how well your ads are performing and how the user interacts with the ad.
If you enjoyed this post and would like to know more features you can set up. Please see my post on Advanced Google Analytics for Marketing Tools.